Let me first apologize for my delay in getting this out. I have been extremely busy with my current project, however, I think you will be pleased with what I have researched for today’s blog.
I had the opportunity to collect a considerable amount of production data at a customer site over the past two months. I am posting this data with permission from the customer on condition of anonymity. I figured it would be useful to the community because not a lot of data exists about how many IOPS you need per user on a XenApp server. With a XenDesktop user, I expect a light user to generate around 6 IOPS. With a single user on a XenApp server, I had no idea.
As it turns out, even though I was collecting the data to figure out issues with their login times, I had also collected the physical disk information for that same period of time, so I figured I might as well take time to analyze and post the results in case it helps anyone else who is trying to plan their XenApp environment.
Please realize that all the data collected was done on live XenApp servers in a production load-balanced pool. This load generation strategy has two key implications. First, the load across the servers is not identical or controlled in any manner, though it is fairly consistent as you will see. Second, the data does not represent the behavior under a full load. The good news is that we have real user data though instead of simulated load data, we just need to be smart about how we analyze it, such as adjusting for the number of active users.
Environment
A little about the different configurations I was testing. Four server configurations were used to collect the data. Each of these servers ran the same 32-bit Windows Server 2003 XenApp 5 vDisk streamed via Provisioning Services (my preferred method) with write-back cache drives on the local storage (also my preferred configuration) of the XenServer. In all cases, the XenApp servers were hosting a single medical EMR application with no PACS software running (this is key information because PACS applications typically require higher IOPS) on the server. The following table shows the pertinent information regarding the server configurations.
| Identifier | Server Config RAM/Cores |
Drives | XenApp VMs Running on Host | Notes |
| BLSAS | BL465c G5 / XenServer 5.5 32 GB RAM/8 |
2x146GB 10K SAS 2 x RAID1 |
4 | Hypervisor and write-back cache drives on RAID1 |
| BLSSD | BL465c G5 / XenServer 5.5 32 GB RAM/8 |
2x120GB SSD 2 x RAID1 |
4 | Hypervisor and write-back cache drives on RAID1 |
| DLSAS1 | DL385 G6 / XenServer 5.6 48 GB RAM/12 |
4x146GB 10K SAS 4 x RAID10 |
6 | Hypervisor and write-back cache drives on RAID10 |
| DLSAS2 | DL385 G6 / XenServer 5.6 48 GB RAM/12 |
4x146GB 10K SAS 2 x RAID1 2 x RAID0 |
6 | Hypervisor on RAID1. Write-back cache drives on RAID0 |
This table can be used as reference point when I discuss the performance statistics below. Each of the supplied charts have the server identifier included in the title to link the data back to the server configuration in the table above. The only difference between the DLSAS1 and DLSAS2 configurations is that the hypervisor disk I/O is on separate disk, and as such we can use these two configurations to look at the impact of the hypervisor traffic on the IOPS requirements.
Pursuant to the philosophy and approach of my earlier tests for XenDesktop, the key performance metrics should be gathered during the booting and steady-state phases. In an environment where Provisioning Services (PVS) is used to stream the operating system to the target server, the booting phase typically places the most stress on the storage infrastructure because the target device has to initialize the write-back cache. When analyzing XenApp servers, the logon/logoff traffic would be included in the steady-state phase because that is part of normal operation on a XenApp server.
The data I present here comes from a series of discreet test scenarios and since this is a blog and not a whitepaper, I have presented only a subset of the information gathered. I am taking the highlights from the data to provide a better overall picture for estimating IOPS on XenApp. One scenario involved moving to SSDs for the write-back cache on the blade servers to see if it improved logon performance. This is the data provided in Steady-state IOPS section. Although it did improve the performance, it was not as significant as I expected (more on this in a later blog) so we continued to investigate by using four SAS drives instead of the SSDs. The Boot IOPS section has data that originated from tests designed to determine if SAS drives in different RAID configurations provided ample performance for a lower cost point.
Boot IOPS Requirements
The storage configurations were setup to determine whether a RAID0 drive array would perform better than fully fault-tolerant RAID10 array. Theoretically, the RAID0 array for hosting the volatile write-back cache drives would perform better because the RAID array would have the same read/write capacity as RAID10 array and not have hypervisor traffic to contend with. A 4-disk RAID10 array has a read IOPS capacity of around 1000 (4 *250) IOPS. However, since it is a mirror, it also has a write penalty of 2 because all write IOPS have to be written to both the primary and mirror set. Therefore, the write IOPS capacity is around 500 (1000/2). The 2-disk RAID0 array has the write IOPS capacity of 500 (2*250) as well because a RAID0 set is striped and takes no penalty.
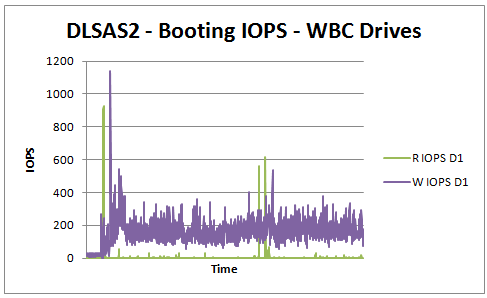
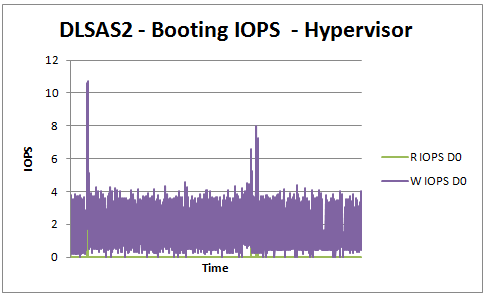
The data in the graphs below depicts the IOPS measured by the IOSTAT command at the XenServer console over a 90-minute period with a 15-second sampling interval. Although 90 minutes of data is provided, the boot process for the XenApp servers was complete within the first 10% of the graph period. All servers on each hypervisor were booted within 10 seconds of one another. These servers were placed into production, so the remaining period reflects the steady-state usage as the server was populated. A data table providing summary results is shown below the charts.
| Peak Read | Peak Write | Avg Peak Read IOPSper XenApp server | Avg Peak Write IOPSper XenApp server | |
| BLSSD | 1846.33 | 671.13 | 461.58 | 167.78 |
| DLSAS1 | 653.03 | 1062.03 | 108.84 | 177.00 |
| DLSAS2 – RAID0 | 925.40 | 1140.40 | 154.23 | 190.07 |
| DLSAS2 – RAID1 | 3.80 | 10.73 | 0.63 | 1.79 |
I have drawn two primary conclusions from from this data.
- At the peak booting period, the each XenApp server was generating around 200 write IOPS of activity on average, 99% of which was going into the write-back cache.
- On DLSAS2 where the hypervisor (RAID1) was separated from the write-cache drives (RAID0), we can conclude that the hypervisor load on the boot process is not significant.
Two other interesting observations on this data include the following:
- Since booting is the most resource intensive operation, using it to gauge the performance between DL385 storage configurations seemed like a good idea. Although the RAID0 array is able to show better performance numbers than the RAID10 array, the data seems to suggest the difference is not significant enough to warrant the risk associated with moving to an unprotected array, even for write-cache drives.
- The boot process seems to require a high amount of read IOPS from the storage at the beginning, even before the write-cache drive begins to get busy. My best guess for this behavior is the write-back cache drive is read before it is deleted, but that is just a guess. If anyone out there can explain this, that would be helpful.
A pair of SSDs can easily handle the load represented above. However a 4-disk RAID10 array of 10K disks has the capacity to handle about 1000 read IOPS (4*250) but only about 500 (1000/2) write IOPS. So, how does that account for situations where the write IOPS were over 500? The answer – controller cache. Both the DL385 servers used included a drive controller with onboard cache, in this instance it seems to have filled the bill allowing the drives to exceed the rated capacity to meet demand.
From this data, I tend to conclude that 200 IOPS per XenApp server is probably a safe ballpark estimate to use for boot IOPS when planning for XenApp servers in a similar configuration.
Steady-state IOPS Requirements
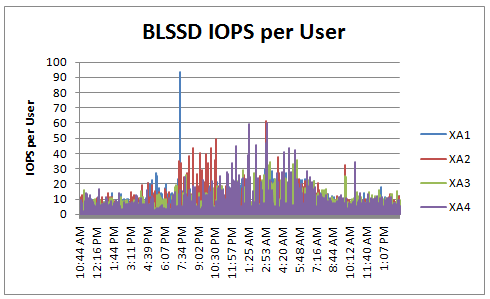
The data for this section was gathered during a two-day period from eight production 32-bit Windows Server 2003 XenApp 5 servers across two BL465c XenServer 5.5 hosts which ranged from a maximum of 31 to 34 users and on average had about 17 users active. The goal of the test was to determine if removing the disk I/O bottleneck improved the user’s login experience improved. Once again though, this data also serves my purpose for determining a what a reasonable steady-state IOPS value would be for a XenApp user. Since the servers each had a different number of users at any given time, the easiest approach was to calculate IOPS per user at each 15-second sample interval and then analyze those results. The charts below provide a view of what the IOPS/user values were for 18 hours of that two-day window. Summary table for the data is provided below the charts.
| Peak IOPS/Server | Average IOPS/Server | Peak IOPS/User | Average IOPS/User | Maximum Active Sessions | Average Active Sessions | |
| XA1 | 1025.38 | 52.94 | 93.22 | 3.26 | 32 | 17.79 |
| XA2 | 965.63 | 52.99 | 61.3 | 3.25 | 31 | 17.75 |
| XA3 | 731.24 | 54.61 | 57.52 | 3.2 | 31 | 17.78 |
| XA4 | 989.72 | 52.15 | 60.24 | 3.26 | 31 | 17.7 |
| XA5 | 1221.87 | 52.29 | 87.28 | 3.27 | 34 | 17.06 |
| XA6 | 765.57 | 45.63 | 109.37 | 3.14 | 33 | 16.5 |
| XA7 | 803.6 | 49.76 | 91.39 | 2.15 | 33 | 16.56 |
| XA8 | 700.58 | 34.16 | 114.8 | 3.27 | 33 | 16.37 |
| Maximum | Average | Minimum | |
| Peak IOPS/Server | 1221.87 | 900.45 | 700.58 |
| Average IOPS/Server | 54.61 | 50.29 | 34.16 |
| Peak IOPS/User | 114.80 | 84.39 | 57.52 |
| Average IOPS/User | 3.27 | 3.10 | 2.15 |
| Maximum Active Sessions | 34 | 32.25 | 31.00 |
| Average Active Sessions | 17.79 | 17.19 | 16.37 |
Some interesting observations about this data.
- XenApp servers with the write-back cache drive on SSD drives have a slightly higher (3.24 vs 2.96) IOPS per user, but also had on average one more user (17.76 vs 16.62) on the server.
- The average IOPS per user for both types of drives seems to be fairly consistent across the 8 servers with most peak average IOPS values ranging between 3.14 and the maximum peak average IOPS per user value of 3.27.
During my tests, moving to an SSD for the write-back cache significantly improved the XenApp server boot time and the user experience once logged on. In addition, the servers hosting the SSDs for the write cache had on average about 20% more CPU resources. These CPU resources were freed up because the processor was no longer waiting on disk I/O to be completed.
From this data, I would conclude that since the peak average IOPS per user seems to be the consistent across the XenApp servers that a decent ballpark value for this user load in this environment is around 3 IOPS per concurrent user.
Determining storage requirements
Now I have this data how would I put it all together? If I was planning a XenApp deployment using streamed PVS vDisks in this environment which numbers would I focus on? If this sample data was representative of 100% of the XenApp servers then here is how I would approach the design.
- Determine the number of concurrent users expected for a single XenApp server. For this use case, the client is targeting 35-50 concurrent users. We will use 50, since it is the maximum they expect to have on a single server.
- Using the Maximum value for the Average IOPS/User (which equates to the “peak average iops” in the XenDesktop world) of 3.27 provides the lower bound for the servers IOPS requirement of about 165 IOPS (50*3.27) per XenApp Server.
- Because I don’t want a boot storm to bring my storage to its knees, the booting IOPS requirement from the first section should be considered. In this case that is around 170 for a BL465 and a 190 for a DL385.
- The next step would be to determine the number of XenApp servers that will be hosted on a single XenServer host. This value could be limited by the available RAM, processor, or even the storage performance as calculated in Step 3 above. For this use case, the client is expecting 4 servers on a BL465c and 6 servers on a DL385.
- Plugging in the numbers results in a minimum storage write IOPS capacity of 680 for a BL465c server, with the calculated range being 660-680 (per user – booting), to host four XenApp servers. A DL385 server with six XenApp servers would need a minimum storage write IOPS capacity of 1140 with the calculated range being 990-1140. You notice I always select the top of the range for my value. I do this because it is the more conservative choice and my reputation is on the line.
It so happens in this example the booting IOPS are actually higher than per user calculations. If the user density expected was higher here it could easily have been the other way around. Of course, faster storage is also an option. In fact, if funds permit, the goal would be to use the upper bound of the IOPS for the calculations. To calculate the upper bound I would use the Average Peak IOPS/User value of 84.39. This means that the IOPS requirement would be about 4250 (50*85) per XenApp Server, or 17000 write IOPS for a BL465C and 25000 IOPS for a DL385. Though this level of performance is not likely to be required it could be the client wants maximum performance no matter the cost, in which case I would use this value for calculating the required performance of the storage system.
One other note here is that if the workload tested is not indicative for all XenApp servers (for instance if the client has multiple application silos) then the tests should be run on each of the workload vDisks. If that is not feasible, pick the one with the heaviest I/O load (like PACS) so you have a worst-case scenario plan.
Final Takeaways
Understanding that each customer environment is unique with respect to applications, user characteristics, and architecture is the key to success in this space. However, sometimes you have to provide ball park values without any idea what the actual load would be on a server to keep the deal moving forward. Always use actual pilot data whenever possible, and don’t go around quoting me on these number because they are specific to this client. However, you can use them as a guideline if you don’t have your own yet.
For now, my SWAG on a “light to normal” user load for XenApp will be 3 IOPS per concurrent user. Given the same user in XenDesktop is 6 – 10 IOPS, that means that XenApp probably reduces the IOPS load by 30-50% over XenDesktop. Knowing that, until I have better data, I would use the same formulas that I do for estimating XenDesktop IOPS, but adjust them by a third to a half when that user is on XenApp. If that number works out to less than 200 IOPS per XenApp server, I will probably round it up to 200 because of the boot IOPS recommendation I have identified above.
If you have comments feel free to add them below. If you found this article useful and would like to be notified of future blogs, please follow me on Twitter @pwilson98.


February 10th, 2011 → 1:49 PM
[…] This post was mentioned on Twitter by Daniel Feller and Danny van Dam, Craig Jeske. Craig Jeske said: Great blog from @pwilson98 to help planning IOPS for #Citrix #XenApp deployments http://bit.ly/elUGvz […]